Back testing BED:ETH price ratio

With the passing vote on IIP-54, I’ve been looking at backtesting the behaviour of BED:ETH pair on uniswap.

My goal is to try and understand how much the prices diverge over time between rebalences as this will be a key consideration in setting liquidity ranges on Uniswap v3. Instinctively I think BED:ETH should be pretty stable, but I wanted some data to work with.

Data was downloaded from Coingecko (in both USD and ETH terms) and then manipulated in a spreadsheet.

This analysis assumed that there were no significant spikes in ETH:DPI or ETH:BTC prices between thaes dailty checkpoints.

This is my progress to date:

Note, most of this data is presented in ETH price terms as that is what the liquidity pool will be. It always takes me some time to move from thinking about USD to ETH value, but it is well worth this mental juggling to understand the liquidity pair.

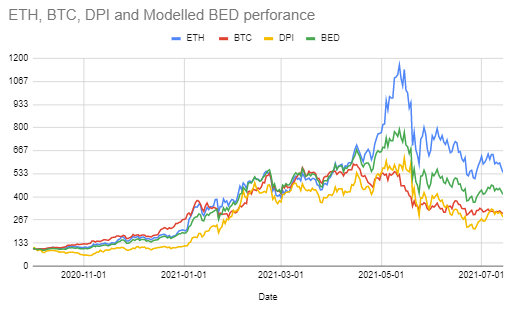
The first chart looks at the components and a simple 1/3 ETH, 1/3 DPI and 1/3 wBTC fund held (without rebalencing) since the start date all prices in ETH. Overall the chart isn’t that informative with DPI and wBTC underperforming ETH over the last 10 months and BED being intermediate.

Chart 1

Overall, it looks like the modelled BED has stayed in a range between +0 and -38% vs ETH since creation on 14th September.

This indicates that a very large liquidity range may be required. However, if we assume that the liquidity will be repositioned, it makes sense to look at a range of start dates.

If we just look at buying BTC, ETH, & DPI and hold them cold on the 1st of each month, the chart for the untokenised BED looks like this ugly mess:

Chart 2

This is actually more worrying as it implies that there are times when a static (non-rebalancing) BED can undergo significant price changes vs ETH (e.g. 01Mar21 +25% to -25% in 10 weeks). Such a profile implies that we may need large TLV in the pool, or be repositioning it on a frequent basis.


Following this, I looked at what would happen if we rebalance BED each month.

  1. 1st October Equal values of wBTC, DETH and DPI were purchased, then the portfolio performance was tracked over the month.
  2. 1st November the portfolio value is calculated, and then redistributed 1/3 : 1/3 : 1/3 and allowed to run another month.
  3. Repeat until 14th July 2021.
    note, this calculation is not perfect as the recalculation is assumed to happen over 24 hours with no relative price changes - however, the error is expected to be small

Chart 3
image

Note, this calculation is not perfect as the recalculation is assumed to happen over 24 hours with no relative price changes - however, the error is expected to be small

Compared to the first figure, the rebalancing has a few impacts starting from the 1st October 2020:

  • BED actually out performed ETH in March
  • The drawdown in May was slightly better for the rebalanced BED

Overall the maximum drawdown expected is reduced slightly to ~40% over 10 weeks.


The fourth chart assumes that BED is rebalanced every month (on the 1st) and then looks at the price divergence over the next 40 days (Reblanences may not happen on exactly the same date each month, so adding a few days extra allows us to consider this).

Chart 4

This indicates that starting on any particular 1st of the month, the price divergence is between -30% and +15% over the following 40 days. IN addition for the first 7 days, the range is -12% to +8%.

However, while this is pretty encouraging for positioning/repositioning liquidity, there is a possibility that there are more rapid changes hiding in the middle of the data. So, I repeated the process starting every Monday…

Chart 5

As expected it takes some time for the prices to diverge with at least 4 days to exceed a 10% change and 15 days to pass 20% (although it’s close to 20% after 8 days in 1 case).

Using the same data it’s possible to build a heat map of when the price moves past a given % from the starting point:

Table 1

I think this is the most useful visualisation. How we can use it depends on what we are trying to achieve:

  1. Ensure liquidity at all times
  2. Ensure deep liquidity close to the likely price point for as long as possible
  3. Allow additional depth for buying BED at launch.
  4. Maximise fee income for the LP (Were being out of position for short periods may be preferable to being spread too widely).
  5. Reduce the need to reposition liquidity

For example, a +/- 12.5% range would have been in the range after:

  • 15 days 95% of the time
  • 40 days 70% of the time

And so on.

I’ll add another post with my thoughts on how we can use this data

Regards

OA

3 Likes

One bonus chart: This is ETH, BTC, DPI, Modelled BED (with rebalancing) since 01 October 2020 starting at a nominal 100:
image

1 Like

Absolutely amazing @overanalyser .

I think many will be surprised (I have!) about the significance of the difference in price fluctuations between BED and ETH given the perceived notion of high correlation. The fact that strategic decisions are supported by rigorous quantitative assessments is great.

Is there such an analysis for the MVI:ETH pair ?

1 Like

@overanalyser awesome awesome work pulling all of this together - just wanted to not that I have made an initial pass through but will try to find some time to dig in and respond her over the next 2-3 days!

1 Like

Hi,

I don’t have anything similar for MVI, but that should be much easier to look at. You can download the historical MVI:ETH price from coingecko and then work on that.

My personal experience for MVI:ETH is that it’s much more volatile…

Likewise we can look at DPI / other products that have been launched.

1 Like

You can compare the historical prices and ratios of any tokens against any IC product on the XXX VS XXW tab on this spreadsheet. (You will need to make a copy to use it) Thanks

2 Likes

@overanalyser - once again just wanted to say that this data wrangling is so helpful. We need to get you some air time in the Analytics Working Group :wink:

So it seems to me that the biggest question becomes how often are we willing to re-position?

This is really encouraging if we were willing to take on the burden of re-positioning every 14 days. Do you have a sense yet of how “active” of management we are going to be able to pull off here from an operational perspective? My thought is that we should default to over-management in the early stages as we build repetitions.

3 Likes

Really great post. I’ve learned so much from your writing on liquidity topics, thank you!

The options you pose at the end of the post are worth discussion – ideally our strategy should be tailored to a few key goals.

I would advocate for a starting goal of allowing additional depth for buying BED at launch. After launch, I’d rank:

  • Ensure liquidity at all times
  • Reduce the need to reposition liquidity (we know this is time/resource expense for the coop)

Ensuring deep liquidity at a predicted price point and maximizing fee income for LPs seem like a ton of work and nearly impossible to predict at times. Would love to hear others’ thoughts on this, I’m far from the most educated here!

1 Like

Thank you @jdcook that is high praise indeed, and I would be happy to spend some time with your team.

One thing to note, is that the coop will not have liquidity deployed for the launch - BanklessDAO have already deployed some and plan more.

My planned operating tempo would be something like:

  1. Daily monitoring of the price vs our positions.
  2. Daily monitoring of the total market depth (e.g. $$$ for 1%, $$$ for 2%)
  3. Weekly reporting to the coop.
  4. Repositioning as we go out of range.

Initially, I would want the capability to reposition every few days. But long term I would like a Fixed Repeating Schedule:

  1. Tuesday / Wednesday - review data,
  2. Wednesday weekly report in the forum with recommendations (collect fees, increase / decrease / move)
  3. Thursday - scheduled multisig video call to execute.

As there are other LP’s in the pool, I would tend to go wider / more passive as the operational overhead / individuals time may be more painful to the coop than the lost income.

I’m actually wondering if the best idea would be to go all wide:

  • +/- 30% with $250,000 is ~ $4,000 per 1% price impact.
  • Arbitrage costs ~ $50 to $100
  • Then we should not need to reposition for > 40 days.
  • Low income to coop, but low operational overhead.

Btw, my intuition (i.e. I’ve not verified it) says:
1) total premium is linear with % premium x depth.
2) So moving it back to NAV will extract half of the % premium * depth:
1% premium @ $4,000 per % = 50% * 1% * $4,000 = $20 profit (before costs)
2% premium @ $4,000 per % = 50% * 2% * $4,000 = $40 profit
3% Premium = $60 profit

I’m listening to this podcast and around 1 h 22.55 minutes they speak about how it’s possible to use flashbots to sandwitch your own trades by adding narrow bands of liquidity around the trade and then remove the liquidity in the same transaction. They say that this isn’t prevalent at the moment but it’s easy to imagine that it will become the norm. This would impact the fee revenue from passive LP’s, even with reposition at a moderate pace.
Flashbots, COWswap, maybe Sushiswap’s new trident product and others may offer services where they protect users from this by having the transactions resolve in their siloed and (supposedly) less adversarial MEV environment.

1 Like

I will work on getting analytics resources (either myself or a combo of me + another contributor) to work on this monitoring/reporting.

This is similar to how I feel - we need to be prepare for more active monitoring and management up front as we settle into processes and positions that require less operational overhead - an increase in liquidity from outside parties allows us to relax our own positions, but we should assume up front that we and Bankless DAO are the main providers and need to facilitate positive trading experience.

1 Like