Title: Automated Products Risk Report April 2023
Author: @sidhemraj
Reviewed: @afromac
Yield Products
icETH
Performance
The value of icETH has grown by 0.95% in ETH terms since the beginning of April, and is now at 1.06 ETH per icETH, adding 0.01 per unit. Growth has been steady since November, with some periods of increased APR due to high gas fee periods in mid-March, April. stETH yield remained at 4-5% for much of the month, and stETH traded close to the 1:1 conversion rate (known as “the peg”).
Figure 1: icETH value vs USDC & ETH

Supply Cap
The Supply Cap parameter is a global limit on the total units of icETH that can be created. To ensure the product can safely de-lever in all market conditions, the Index Coop product team determines and gradually expands this limit on units over time. Currently, there are 10.1K units of icETH in circulation, which is equivalent to ~69% utilization of the max Supply Cap. Another 4000 units ($7.2M USD at today’s prices) can be minted before the Supply Cap needs to be raised. Since the beginning of Apri, supply contracted by 200 units, representing ~2% of the total supply.
Parameter updates
No parameter updates were made in April, but we anticipate executing an update to the Supply Cap in the coming months. The current circulating supply of icETH is approximately 66% of the Supply Cap. The Index Coop aims to review and increase the Supply Cap once the circulating supply approaches approximately 80%.
Figure 2: icETH Unit Supply & Supply Cap

Rebalances
No rebalances were triggered by icETH’s Aave Leverage Strategy Contract.
Underlying Liquidity
The stETH:ETH price has remained comparatively stable since the merge last year. Since the beginning of April the stETH:ETH price has ranged from 0.9925 to 1.009, with a standard deviation of 0.0008 (compared to 0.0012 for the earlier period, suggesting a much more stabilized stETH price). Notably, liquidity on the Curve stETH:ETH pool has dropped by over 25%, reaching almost $1.2B, though the discount stETH discount on the pool is much lesser. As this is the primary pool used to rebalance the product, Index Coop will be monitoring liquidity closely.
Figure 3: stETH:ETH price

Aave markets rely on ChainLink price feed aggregators to function securely, so monitoring Chainlink’s stETH:ETH Price feed helps inform product parameter updates, such as leverage ratio bounds. Higher volatility in the stETH:ETH price feed increases the likelihood of triggering a rebalance on icETH, should the leverage ratio fall outside of the acceptable bounds.
DEX liquidity
icETH DEX trades in April had an average price impact of 37 basis points trades of this size, with standard deviation of 0.92%. From another perspective, the average trade size on the Uniswap Pool since April was 9.62 icETH units, with an average price impact of 0.37% at this trade size.
Figure 4 shows the relationship between trade sizes and price impact on the pool. The blue dots above the line represent price impact for trades to buy icETH, while the dots below the line represent trades to sell icETH back to the pool.
Figure 4: Price Impact on the icETH:ETH Uni V3 Pool

The NAV vs DEX premium

Figure 5 compares the icETH DEX price with the Net Asset Value (NAV) in terms of ETH. The icETH price on the Uniswap V3 pool has been closely tracking NAV. The highest percentage premium since the beginning of April was 0.69%, and the average premium (including swap fee) was 0.12%.
Figure 5: icETH Net Asset Value vs DEX Price
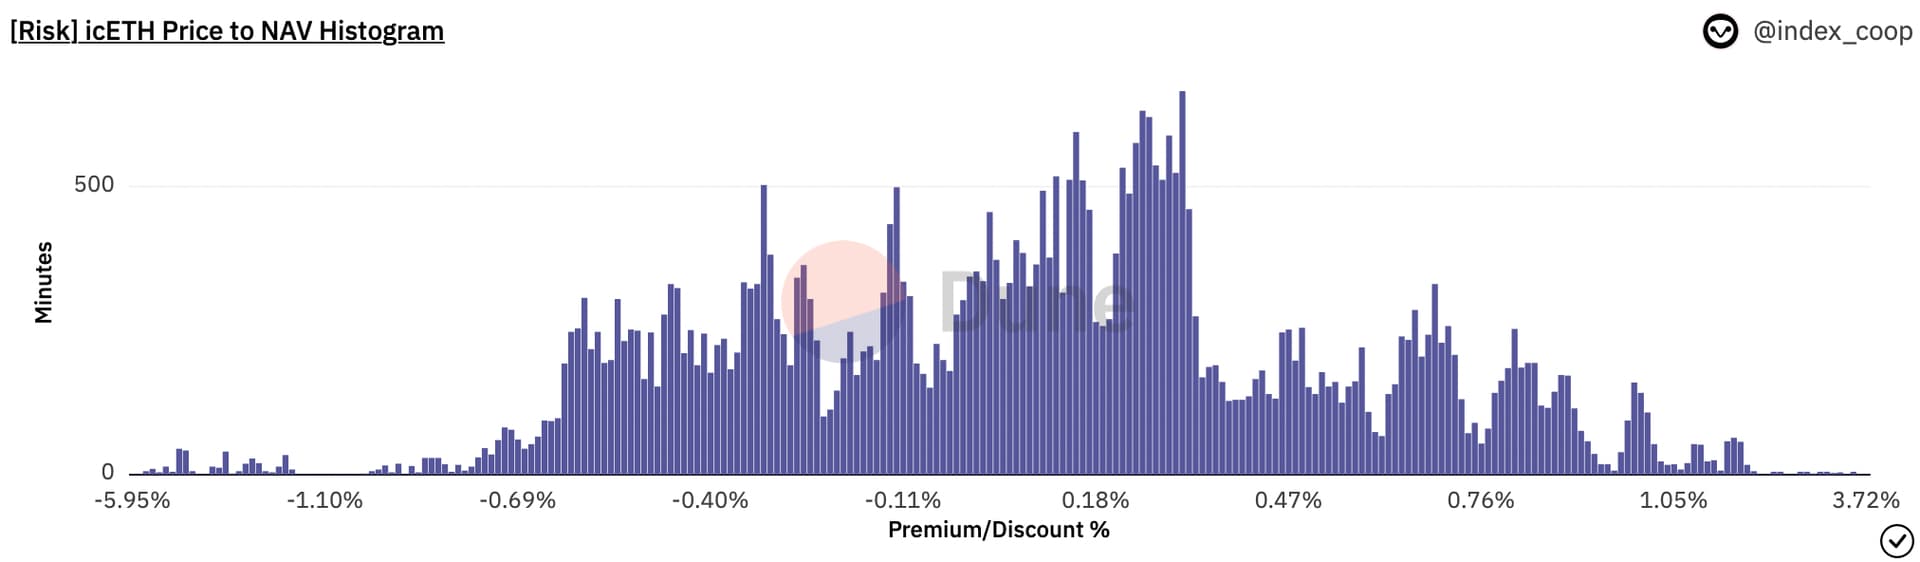
The histogram in Figure 6 shows a distribution for the amount of time that the icETH price traded at various Premium/Discount intervals. A positive number indicates a premium over Net Asset Value (NAV), while a negative number indicates a discount.
Figure 6: icETH time spent at a premium or discount to Net Asset Value
Aave Params
WETH Market parameters, proposed changes & forum discussion
The Aave community is planning to accelerate V3 adoption by halting new listings, and the Aave V3 market was successfully deployed on Ethereum Mainnet in January. The Aave V2 market has 541,000 ETH, ie ~$1B(down from $1.2B) worth of ETH supplied and $600M+ worth of ETH borrowed. As icETH borrows from the Aave V2 ETH market, this could have a major impact on icETH. Therefore, we will closely monitor the developments in order to support the product.
Borrow Rates Over time
ETH borrowing rates on Aave V2 ETH market have been slightly below 4% for most of April, but have started to climb in May due to liquidity , with an instance of the borrowing rate being >4%, as utilization on the Aave V2 ETH has surged to ~60%+ as well, as liquidity migration to Aave V3 has accelerated recently. 70% of all ETH borrowing on Aave V3 is borrowed via e-mode, signaling significant borrowing by leveraged ETH stakers.
Figure 7: Aave V2 ETH Market Borrow Rate

Aave V2 ETH Market Utilization
Aave V2 Markets Utilization is around ~62% at the time of writing of this report, rising due to the recent migration of ETH liquidity from Aave V2 to V3.
Migration to Aave V3
Index Coop is actively developing the Aave v3 Leverage Module, which will enable an icETH V2 that will utilize Aave V3 as the underlying borrowing protocol.
Leveraged Products
ETH2x-FLI
Performance
Since the beginning of April, ETH price has touched $2000 and fallen back to $1800, while the price of ETH2x-FLI NAV has dropped by 3% over the same period. The below chart shows the performance of both assets.
Figure 8: ETH2x-FLI and ETH Price

Illustrative Benchmarking:
We can compare the performance of ETH2x-FLI to that of a simple 2x Leveraged ETH position, which experiences no volatility drift. The tracking error, illustrated in Figure 9, is the percentage difference in price rises and falls between the two positions. As a result of this divergence between actual and idealized performance, the price of ETH2x-FLI underperformed a perfect 2x ETH position by 1.18% over a 30 day period. Performance differences can often be attributed to frequent rebalancing during periods of high volatility, which can cause volatility decay.
Figure 9: ETH2x-FLI 30 day performance comparison to a simple 2X ETH position

Similarly, please find the linked 60 day and 90 day performance comparisons in which an ETH2x-FLI position also underperformed a simple 2xETH position by 2.1% in the 60 day period and 3.9% over a 90 day period.
Parameter Updates
No parameter updates were made during this period, and ETH2x-FLI continues to solely rely on the UniV3 ETH:USDC pool to rebalance daily.
Supply Cap
The Supply Cap parameter is a global limit on the total units of ETH2x-FLI that can be created. To ensure the product can successfully de-lever in all market conditions, the Index Coop product team determines and gradually expands this limit on units over time. Currently, there are 1.37M units of ETH2x-FLI in circulation, which is equivalent to 54% utilization of the max Supply Cap. A further 630,000 units ($7M at today’s prices) of ETH2x-FLI can be minted before the Supply Cap needs to be raised. Since the beginning of April, 10,000 units have been minted, representing a 0.76% rise month on month.
Figure 10: ETH2x-FLI Unit Supply & Supply Cap

Rebalances
Currently, ETH2x-FLI uses the UniV3 ETH-USDC 0.05% fee pool as the sole source of liquidity for rebalancing; Sushi and UniV2 are no longer utilized as DEXs to facilitate rebalances. This change provides an additional benefit to product holders in the form of greatly improved capital efficiency on UniV3.
The average Price Impact (PI + Swap Fee) for rebalancing is now less than 0.1%.
Figure 12 shows the price impact at various rebalance sizes for ETH2x-FLI. Since the beginning of April, ETH prices have been on a steady rise, almost all rebalance trades have been less than $250K(with a few exceptions), with an average Price Impact of approximately 0.05%.
Figure 12: ETH2x-FLI rebalances & price impact on Uniswap V3

Notable Events
No notable events occurred in the current period, as ETH2x-FLI rebalanced daily as expected.
Underlying Liquidity
UniV3 was the only DEX utilized for ETH2x-FLI rebalancing following a parameter update in November. Liquidity on the ETH/USDC pools on Sushi, UniV2 has been healthier since the beginning of April, and the UniV3-0.3% Fee pool is a backup for rebalancing.
Figure 14: Sushiswap ETH-USDC pool Liquidity

Figure 15: Uniswap V2 ETH-USDC pool Liquidity

Figure 16: Uniswap V3 ETH:USDC Liquidity

NAV vs DEX premium
The ETH2x-FLI price on DEXs has accurately tracked the Net Asset Value since the beginning of April. The NAV vs DEX premium has remained between -6% to 4%.
Figure 17: ETH2x-FLI Net Asset Value vs DEX Price
Product Liquidity
The Uniswap V3 ETH2x-FLI:ETH 30bps pool is the dominant liquidity pool for the product, capturing over 90% of the ETH2x-FLI trade volume. On trades up to $20,000, the Price Impact incurred was around 1%. ETH2x-FLI buy trades had a positive price impact, indicating that a premium was paid over NAV, while sell trades had a negative price impact, indicating that ETH2x-FLI was sold at a discount to the market price.
Figure 18: ETH2x-FLI Uni V3 Trades & Price Impact

Compound Market Parameters
ETH2x-FLI borrows from the USDC market on Compound V2, so any changes to the protocol’s parameters affect the product’s performance. No major changes were made to the Compound V2 USDC market during the given period.
BTC2x-FLI
Performance
The price of BTC2x-FLI has dropped by 11% in dollar terms since the beginning of April.
Figure 20: BTC2x-FLI Price Performance during April 2023

Base Asset Terms
The price of BTC has dropped by approximately 5.2% since the beginning of April, and the BTC2x-FLI NAV has fallen by ~11%.
Figure 21: BTC2x-FLI vs BTC Price

Parameter updates
No Parameter updates were made during this period.
Rebalances
The majority of BTC2x-FLI rebalance trades were executed through the UniswapV3 BTC:USDC 0.30% pool. All rebalances had a price impact of less than 0.4%, including LP fees. Rebalances to leverage up had a positive price impact, as BTC was bought at a premium to market price, while rebalances to leverage down had a negative price impact, as BTC was sold at a discount.
Figure 23: BTC2x-FLI rebalance transactions and price impact

Notable Events
No notable events occurred in the current period, as BTC2x-FLI rebalanced daily as expected.
Underlying Liquidity
The TVL/Dollar value of liquidity in Sushi and UniV2 pools has been largely stable throughout April, and we will be monitoring these pools as a backup source of liquidity.
Figure 25: Sushiswap WBTC:WETH pool liquidity

Figure 26: Uniswap V2 WBTC:WETH pool liquidity

The liquidity of the WBTC:WETH UniV3 0.3% fee pool has been sufficient for the safe operation of the product, with ample depth around a wide range of prices.
Figure 27: Uniswap V3 WBTC:WETH pool liquidity

Supply Cap
The Supply Cap parameter is a global limit on the total units of BTC2x-FLI that can be created. By determining and gradually expanding this limit, the Index Coop product team can safely increase the maximum number of units over time and ensure the product can de-lever successfully in all market conditions.
Currently, there are 284,000 units of BTC2x-FLI in circulation, which is equivalent to 28.4 % utilization of the max Supply Cap. A further 500,000 units ($3.5M at today’s prices) of BTC2x-FLI can be minted before the Supply Cap needs to be raised. BTC2x-FLI Unit Supply has dropped by around 3% since the start of April.
Figure 28: BTC2x-FLI Unit Supply and Supply Cap

NAV vs DEX Premium
BTC2x-FLI chart in Figure 29 visualizes these indicators by the hour instead of the minute.
The price of BTC2x-FLI on DEXs deviates from its NAV significantly more often than ETH2x-FLI, with a couple of extreme deviations of -10.62% and 6.99%. The Average Premium/Disc for BTC2x-FLI is 1.89%. This NAV deviation is caused by lower trade volume and DEX liquidity, making it less economical for arbitrage bots to trade. This lower liquidity and trade volume also makes it difficult to interpret Price vs NAV visualizations at shorter time intervals. The BTC2x-FLI chart in Figure 29 visualizes these indicators by the hour instead of the minute.
Figure 29: BTC2x-FLI Net Asset Value vs DEX Price

Product Liquidity
Due to the low liquidity for BTC2x-FLI on DEXs, we recommend flash-minting BTC2x-FLI via the Index-Coop App.