Title : December 2022 Automated Products Risk Report - Analysis of Risk to holders of Automated Indices maintained by the Index Coop community, namely icETH, ETH2x-FLI & BTC2x-FLI.
Authors : @sidhemraj
Reviewed by : @afromac
Date of writing : 12th January 2023
Date of publishing : 18th January 2023
Preface
At Index Coop’s Product pod, we are always looking to adopt best practises around Risk Management and reporting on market factors affecting product performance. Communities at MakerDAO, Aave, Compound
have set a high example of dynamic risk parameter updates, and we want to adopt best practices wherever necessary.
Yield Products
icETH
Performance
During December, icETH outperformed ETH by 0.56%. This is slightly slower growth when compared to November, due to higher borrowing costs on the Aave V2 ETH market. The change was largely driven by post merge stETH yield holding up close to 5% for most of the month, as well as stETH trading closer to a 1:1 conversion rate (sometimes referred to as “the peg”).
Figure 1: icETH value vs USDC & ETH

Supply Cap
The Supply Cap parameter is a global limit on the total units of icETH that can be created. Determining and gradually expanding this limit on units enables the Index Coop product team to safely increase the maximum number of units over time and ensure the product can successfully de-lever in all market conditions. Currently there are 10.5K units of icETH in circulation. This is equivalent to 70% utilization of the max Supply Cap. A further 4,000 units ($5.3M USD at today’s prices) of icETH can be minted before the Supply Cap would need to be raised. A total of 100 units were issued in December, a 1% growth month on month.
Parameter updates
No parameter updates were made in December, but we anticipate executing an update to the Supply Cap in the coming months. Current circulating supply of icETH is ~70% of the Supply Cap. Index Coop aims to review and increase the supply cap once circulating supply approaches ~80%.
Figure 2: icETH Unit Supply & Supply Cap

Rebalances
No rebalances were triggered by icETH’s Aave Leverage Strategy Contract.
Underlying Liquidity
The stETH:ETH price has remained comparatively stable post merge. During December, the stETH:ETH price ranged from 0.96 to 1.01, with the standard deviation of 0.002. Notably, liquidity on the Curve stETH:ETH pool increased by 25%+, rising from $760M to $960M, stabilizing the stETH:ETH exchange rate. As this is the primary pool used to rebalance the product, Index Coop will monitor liquidity closely.
Figure 3: stETH:ETH price
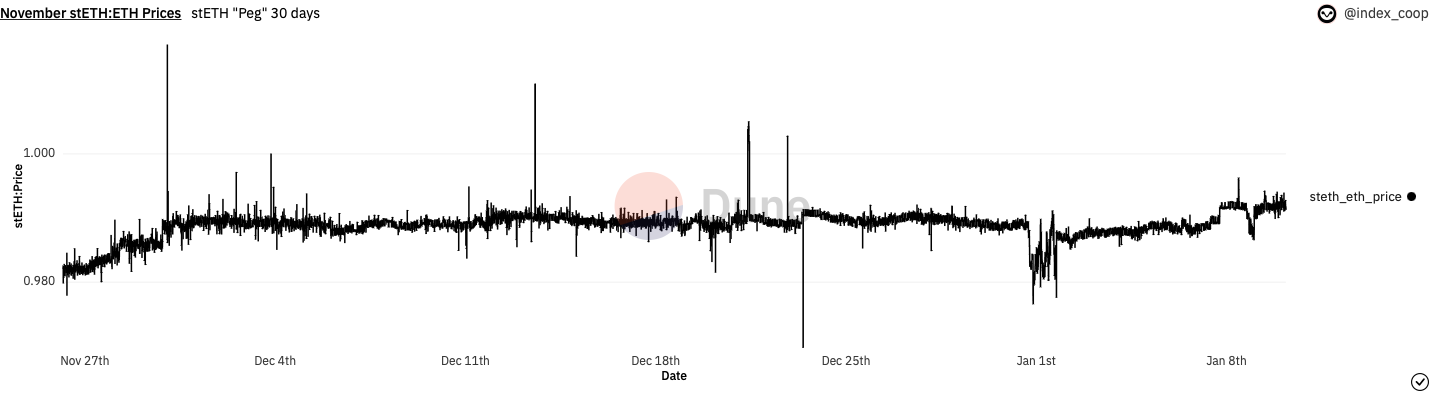
Aave markets rely on ChainLink price feed aggregators to function securely, so monitoring Chainlink’s stETH:ETH Price feed helps inform product parameter updates like leverage ratio bounds. Higher volatility in the stETH:ETH price feed increases chances of triggering a rebalance on icETH as the leverage ratio falls out of the acceptable bounds.
DEX liquidity
Most icETH DEX trades in December were below $50K, with an average price impact of this size trade of below 30 basis points. From another perspective, the average trade size on the Uniswap Pool during December was 13 icETH units, with an average of 0.28% price impact at this trade size.
The chart below shows the relationship between Trade Sizes and Price Impact on the pool. The blue dots above the line represent price impact for a trade to buy icETH, while the dots below the line represent trades to the pool to sell icETH back to the pool.
Figure 4: Price Impact on the icETH:ETH Uni V3 Pool

The NAV vs DEX premium
The below chart compares icETH DEX price with the Net Asset Value (NAV) in terms of ETH. The icETH price on the Uniswap V3 pool has been closely tracking NAV; the highest percentage premium during December was 0.69%, and the average premium (incl swap fee) was 0.12%.
Figure 5: icETH Net Asset Value vs DEX Price

The below histogram in Figure 6 shows a distribution for the amount of time the icETH price traded at various Premium/Discount intervals. A positive number indicates a premium over Net Asset Value (NAV), while a negative number indicates a discount.
Figure 6: icETH time spent at a premium or discount to Net Asset Value

Aave Params
WETH Market parameters, proposed changes & forum discussion
The Aave community is planning to accelerate V3 adoption by halting new listings. As icETH borrows from Aave V2 ETH market, this would have a major impact on icETH. We will monitor the developments closely to support the product.
Borrow Rates Over time
ETH borrow Rates on Aave V2 ETH market were in the 2-3% range for most of November and December before the proposed interest Rate Curve update was implemented on Dec 18th, which pushed borrow rates beyond 4.5% for a week, affecting the Net icETH yield vs stETH. Borrow rates have settled below 4% (3.84% at the time of writing), following additional $100M+ in deposits on the ETH market as well as sizable repays, pulling utilization back to <60%.
Figure 7: Aave V2 ETH Market Borrow Rate

Figure 7A: Aave V2 ETH Market Utilization

Migration to Aave V3
Index Coop is actively researching steps to upgrade or replace icETH using Aave v3 as the underlying borrowing protocol.
Leveraged Products
ETH2x-FLI
Performance
During December, ETH price has risen by 10%, while the price of ETH2x-FLI grew by ~19% over the same period. The below chart shows the performance of both assets.
Figure 8: ETH2x-FLI and ETH Price

Illustrative Benchmarking:
We can compare ETH2x-FLI performance to a simple 2x Leveraged ETH position, which experiences no volatility drift. Illustrative tracking error, as shown in the chart below, is the percentage difference in price rise and fall between the 2 positions. Due to this divergence between actual and idealized performance, the price of ETH2x-FLI outperformed a perfect 2x ETH position by 0.6% over a 30 day period , due to relatively stable ETH prices over the last month.
Figure 9: ETH2x-FLI 30 day performance comparison to a simple 2X ETH position

Similarly, please find the linked 60 day and 90 day performance comparisons in which an ETH2x-FLI position also outperformed a simple 2xETH position by 3% in the 60 day period and 20% over a 90 day period.
Parameter Updates
No parameter updates were made during this period, and ETH2x-FLI continues to solely rely on the UniV3 ETH:USDC pool to rebalance daily.
Supply Cap
The Supply Cap parameter is a global limit on the total units of ETH2x-FLI that can be created. Determining and gradually expanding this limit on units enables the Index Coop product team to safely increase the maximum number of units over time and ensure the product can successfully de-lever in all market market conditions.
Currently there are 1.6M units of ETH2x-FLI in circulation. This is equivalent to 65% utilization of the max Supply Cap. A further 400,000 units ($2.8M at today’s prices) of ETH2x-FLI can be minted before the Supply Cap would need to be raised. 50,000 units were issued in December, a ~3% growth month on month. If this rate of growth was sustained at this price level, Index Coop will need to update the supply cap by the end of September.
Figure 10: ETH2x-FLI Unit Supply & Supply Cap

Rebalances
Currently, ETH2x-FLI uses the UniV3 ETH-USDC 0.05% fee pool as the sole source of liquidity to rebalance, Sushi and UniV2 were removed as DEXs . An additional benefit to product holders as a result of this change is the greatly improved capital efficiency available on UniV3. The average Price Impact (PI + Swap Fee ) to rebalance is now less than 0.1%.
The below scatter chart shows price impact at various rebalance sizes for ETH2x-FLI.
With ETH prices remaining relatively stable in December, all rebalance trades have been <$100K with average Price Impact being ~0.1%.
Figure 12: ETH2x-FLI rebalances & price impact on Uniswap V3

Notable Events
No notable events occurred, as ETH2x-FLI operated as expected throughout December.
Underlying Liquidity
UniV3 was the only DEX used for ETH2x-FLI rebalancing following a parameter update in November. We will be monitoring the liquidity on Sushi, UniV2 and UniV3-0.3% Fee pool as backup for rebalancing.
Figure 14: Sushiswap ETH-USDC pool Liquidity

Figure 15: Uniswap V2 ETH-USDC pool Liquidity

Figure 16: Uniswap V3 ETH:USDC Liquidity

NAV vs DEX premium
The ETH2x-FLI price on DEXs tracked the Net Asset Value accurately during December for the large majority of the period. NAV vs DEX premium hovered between -2 to 2% for most of the month, with a couple of instances of breaching the ±4% range, and average deviation of ~0.5%.
Figure 17: ETH2x-FLI Net Asset Value vs DEX Price

Product Liquidity
The Uniswap V3 ETH2x-FLI:ETH 30bps pool is the dominant liquidity pool for the product, and captures 90+% of the ETH2x-FLI trade volume. On trades of up to $10,000, Price Impact incurred was between 1 and 1.3%. ETH2x-FLI buy trades have a positive price impact - indicating ETH2x-FLI price premium paid over NAV, and sell trades have a negative price impact - indicating that ETH2x-FLI sold at a discount to market price.
Figure 18: ETH2x-FLI Uni V3 Trades & Price Impact

Compound market Parameters
ETH2x-FLI borrows from the USDC market on Compound V2, so any updates to the protocol’s parameters affects the product performance. No major updates were made to the Compound V2 USDC market in the given period.
BTC2x-FLI
Performance
BTC2x-FLI price is up 19% in dollar terms, as crypto assets have recovered from the large selloff around FTX collapse.
Figure 20: BTC2x-FLI Price Performance during December 2022

Base Asset Terms
BTC price has risen by ~23% since the end of November, with the BTC2x-FLI NAV rising by 46% in value. (As on 18th Jan 2023)
Figure 21: BTC2x-FLI vs BTC Price

Illustrative Benchmarking:
The chart below compares BTC2x-FLI performance to a simple 2x BTC leveraged position, which experiences no NAV deviation or volatility drift.
Figure 22: BTC2x-FLI 30 day performance comparison to a simple 2x BTC position

In this comparison, the price of BTC2x-FLI underperformed a simple 2xBTC leveraged position by 0.5% over a 30 day period, by 2% in the 60 day period, and 10% over a 90 day period. Please find the linked 60 day and 90 day performance comparisons.
Parameter updates
No Parameter updates were made during this period.
Rebalances
The majority of BTC2x-FLI rebalance trades were executed via the UniswapV3 BTC:USDC 0.30% pool. All rebalances had a price impact of <0.5%, apart from 1 trade which had the price impact of ~1%. Rebalances to lever up have a positive price impact, as BTC was bought at a premium to market price, and rebalances to lever-down have a negative price impact, as BTC was sold at a discount.
Figure 23: BTC2x-FLI rebalance transactions and price impact

Notable Events
No notable events occurred, as BTC2x-FLI operated as expected throughout December.
Underlying Liquidity
TVL/Dollar value of liquidity in Sushi and UniV2 pools has been largely stable through december, and we will be monitoring these pools as a backup source of liquidity.
Figure 25: Sushiswap WBTC:WETH pool liquidity

Figure 26: Uniswap V2 WBTC:WETH pool liquidity

Liquidity on the WBTC:WETH UniV3 0.3% fee pool has been sufficient for safe operation of the product, with plenty of depth around a wide price range.
Figure 27: Uniswap V3 WBTC:WETH pool liquidity

Supply Cap
The Supply Cap parameter is a global limit on the total units of BTC2x-FLI that can be created. Determining and gradually expanding this limit on units enables the Index Coop product team to safely increase the maximum number of units over time and ensure the product can successfully de-lever in all market market conditions.
Currently there are 370,152 units of BTC2x-FLI in circulation. This is equivalent to 37% utilization of the max Supply Cap. A further 430,000 units ($1.43M at today’s prices) of BTC2x-FLI can be minted before the Supply Cap would need to be raised. BTC2x-FLI Supply has been largely stable in December.
Figure 28: BTC2x-FLI Unit Supply and Supply Cap

NAV vs DEX Premium
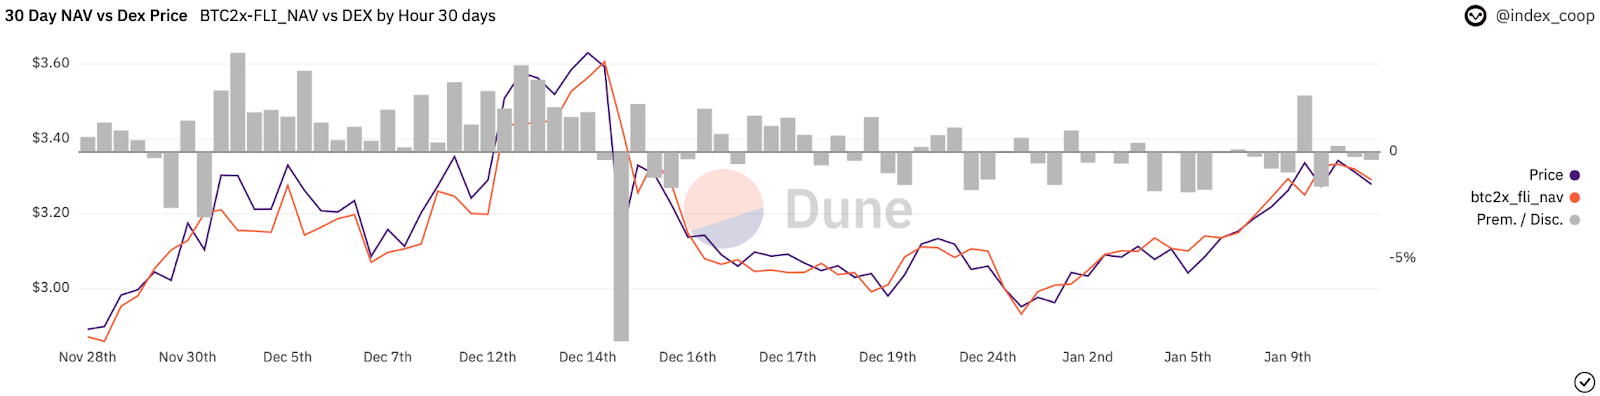
BTC2x-FLI price on DEXs deviates from NAV on significantly more instances than ETH2x-FLI, with a couple of instances of extreme deviation on either side (-8.84% and 4.64%), with Average Premium/Disc being 1.14%. This NAV deviation is driven by lower trade volume and DEX liquidity, making BTC2x-FLI less economical for arbitrage bots to trade. This lower liquidity and trade volume also makes Price vs NAV visualizations harder to read at shorter time intervals. The BTC2x-FLI chart in Figure 29 visualizes these indicators by the hour instead of the minute.
Figure 29: BTC2x-FLI Net Asset Value vs DEX Price
Product Liquidity
Due to the low liquidity for BTC2x-FLI on DEXs, we recommend flash-minting BTC2x-FLI via the Index-Coop App.
Disclaimer
The above risk report was written on 12th January 2023,
and might not capture all of the recent market changes due to the surge in prices across crypto assets.
This report is for informational purposes only and does not constitute an offer to sell, a solici-
tation to buy, or a recommendation for any security, nor does it constitute an offer to provide
investment advisory or other services by Index Coop.